Transcriptional Data Integration
This notebook shows the progress of integrating single-nucleus transcriptomic data with AHBA data.
Introduction
AHBA data
The Allen Human Brain Atlas (AHBA) provides comprehensive, high-resolution transcriptional profiles across the adult human brain. The data was downloaded from the Allen Institute’s API and preprocessed using the abagen package.
Human single-nucleus data
We used the large-scale single-nucleus dataset for the human brain provided by the Linnarsson laboratory.
This dataset includes single-nucleus transcriptomic data collected from multiple brain regions of four adult human donors.
We retained the data from donors (H19.30.001 and H19.30.002) for further analysis and conducted preprocessing with scanpy.
Mouse spatial transcriptomic data
Whole-brain spatial transcriptomic (ST) sequencing data from three adult male mice from Ortiz et al.’s study.
[1]:
import warnings
warnings.filterwarnings('ignore')
import matplotlib
from matplotlib import pyplot as plt
from matplotlib.font_manager import FontProperties
matplotlib.rcParams['axes.spines.right'] = False
matplotlib.rcParams['axes.spines.top'] = False
font_path ='../../tutorials/whitney-medium.otf' # path in TransBrain
custom_font = FontProperties(fname=font_path)

import seaborn as sns

import math
import anndata
import numpy as np
import pandas as pd
from tqdm import tqdm
from scipy import stats
[2]:
import sys
sys.path.append('../code/dintegrate')
[3]:
from utils import stable_gene_filter,calculate_thresholds
Selection of Cross-Modality Stable Genes
In this step, we filtered the shared stable gene space between the AHBA, human single-nucleus data and mouse spatial transcriptomic data.
[5]:
st_genes = list(pd.read_csv('./files/st_genes.csv')['genes'].values)
sn_genes = list(pd.read_csv('./files/sn_genes.csv')['genes'].values)
ahba_genes = list(pd.read_csv('./files/ahba_genes.csv')['genes'].values)
[6]:
common_genes = list(set(st_genes) & set(sn_genes) & set(ahba_genes))
common gene number
[7]:
len(set(common_genes))
[7]:
12732
[8]:
def draw_distribution(corr_, offset=0.008, ymax=0.95):

    median_thre = np.median(corr_)
    fig, ax = plt.subplots(1, 1, figsize=(10, 4), gridspec_kw={'width_ratios': [2]}, dpi=600)

    # KDE plot
    # sns.set_style("ticks")

    plt.rcParams['axes.edgecolor'] = 'black'
    plt.rcParams['axes.linewidth'] = 2

    ax.grid(color='gray', linestyle='--', linewidth=1.5, alpha=0.5,zorder=-100)
    kde = sns.kdeplot(corr_, label='Gene across region', color='gray', alpha=0.5, linewidth=3, ax=ax)
    kde.set_zorder(1)

    x, y = kde.lines[0].get_data()
    idx = np.searchsorted(x, median_thre)

    plt.fill_between(x[:idx+1], y[:idx+1], color='#cdedf6', alpha=1, zorder=1)
    plt.fill_between(x[idx:], y[idx:], color='skyblue', alpha=1, zorder=1)
    plt.axvline(x=median_thre+offset, color='gray', linestyle='--', ymin=0, ymax=ymax, linewidth=2, zorder=2)

    ax.spines['left'].set_linewidth(2)
    ax.spines['bottom'].set_linewidth(2)
    ax.spines['right'].set_visible(False)
    ax.spines['top'].set_visible(False)
    ax.xaxis.labelpad = 20
    ax.yaxis.labelpad = 20
    ax.set_xlim(-1,1)
    ax.set_ylim(0,1.4)
    ax.set_xticks([-0.75, 0.00, 0.75])
    ax.set_yticks([0.2, 0.6, 1.0, 1.4])
    ax.tick_params(axis='both', which='both', labelsize=20, width=2, length=5, color='black')

    plt.xlabel("Value", fontsize=18, fontproperties=custom_font)
    plt.ylabel("Density", fontsize=18, fontproperties=custom_font)

    plt.gca().set_axis_on()
    plt.legend().set_visible(False)
    plt.tight_layout()

    return fig
Selection of cortical stable genes
[9]:
h19_common_regions = pd.read_csv('./files/h19_common_regions.csv')['sn_roi'].values
[11]:
ex_sn_cortex_mean = pd.read_csv('../datasets/processeddata/human_ahba/ex_d_sample_sn_atlas_cortex_mean.csv',index_col=0)
[12]:
ex_sn_cortex_mean.index = ['Human '+region.split(' - ')[-1] for region in ex_sn_cortex_mean.index.values]
Load the processed human single-nucleus data
[13]:
H1901_data = pd.read_feather('../datasets/processeddata/human_sn/Human_sn_data_H19001_split_scaled.feather')
H1901_data.set_index('index',inplace=True,drop=True)
H1902_data = pd.read_feather('../datasets/processeddata/human_sn/Human_sn_data_H19002_split_scaled.feather')
H1902_data.set_index('index',inplace=True,drop=True)
[14]:
cortex_filter_H1901 = H1901_data.index.str.contains('Cerebral cortex')
cortex_filter_H1902 = H1902_data.index.str.contains('Cerebral cortex')
H1901_data_cortex = H1901_data[cortex_filter_H1901]
H1902_data_cortex = H1902_data[cortex_filter_H1902]
[15]:
H1901_data_cortex.index = ['Human '+region.split(' - ')[-1] for region in H1901_data_cortex.index.values]
H1902_data_cortex.index = ['Human '+region.split(' - ')[-1] for region in H1902_data_cortex.index.values]
[16]:
common_regions_cortex = [i for i in set(H1901_data_cortex.index.values) if i in ex_sn_cortex_mean.index.values]
Use stable_gene_filter function to filter genes with consistent spatial patterns between AHBA and single-nucleus data.
[17]:
H1901_cortical_stable_gene_scores = stable_gene_filter(ex_sn_cortex_mean, H1901_data_cortex, common_regions_cortex, common_genes)
H1902_cortical_stable_gene_scores = stable_gene_filter(ex_sn_cortex_mean, H1902_data_cortex, common_regions_cortex, common_genes)
Processing genes...: 100%|██████████| 12732/12732 [00:04<00:00, 2860.39it/s]
Processing genes...: 100%|██████████| 12732/12732 [00:04<00:00, 2638.27it/s]
[18]:
H1901_thre_cortex = np.median(H1901_cortical_stable_gene_scores.values)
H1902_thre_cortex = np.median(H1902_cortical_stable_gene_scores.values)
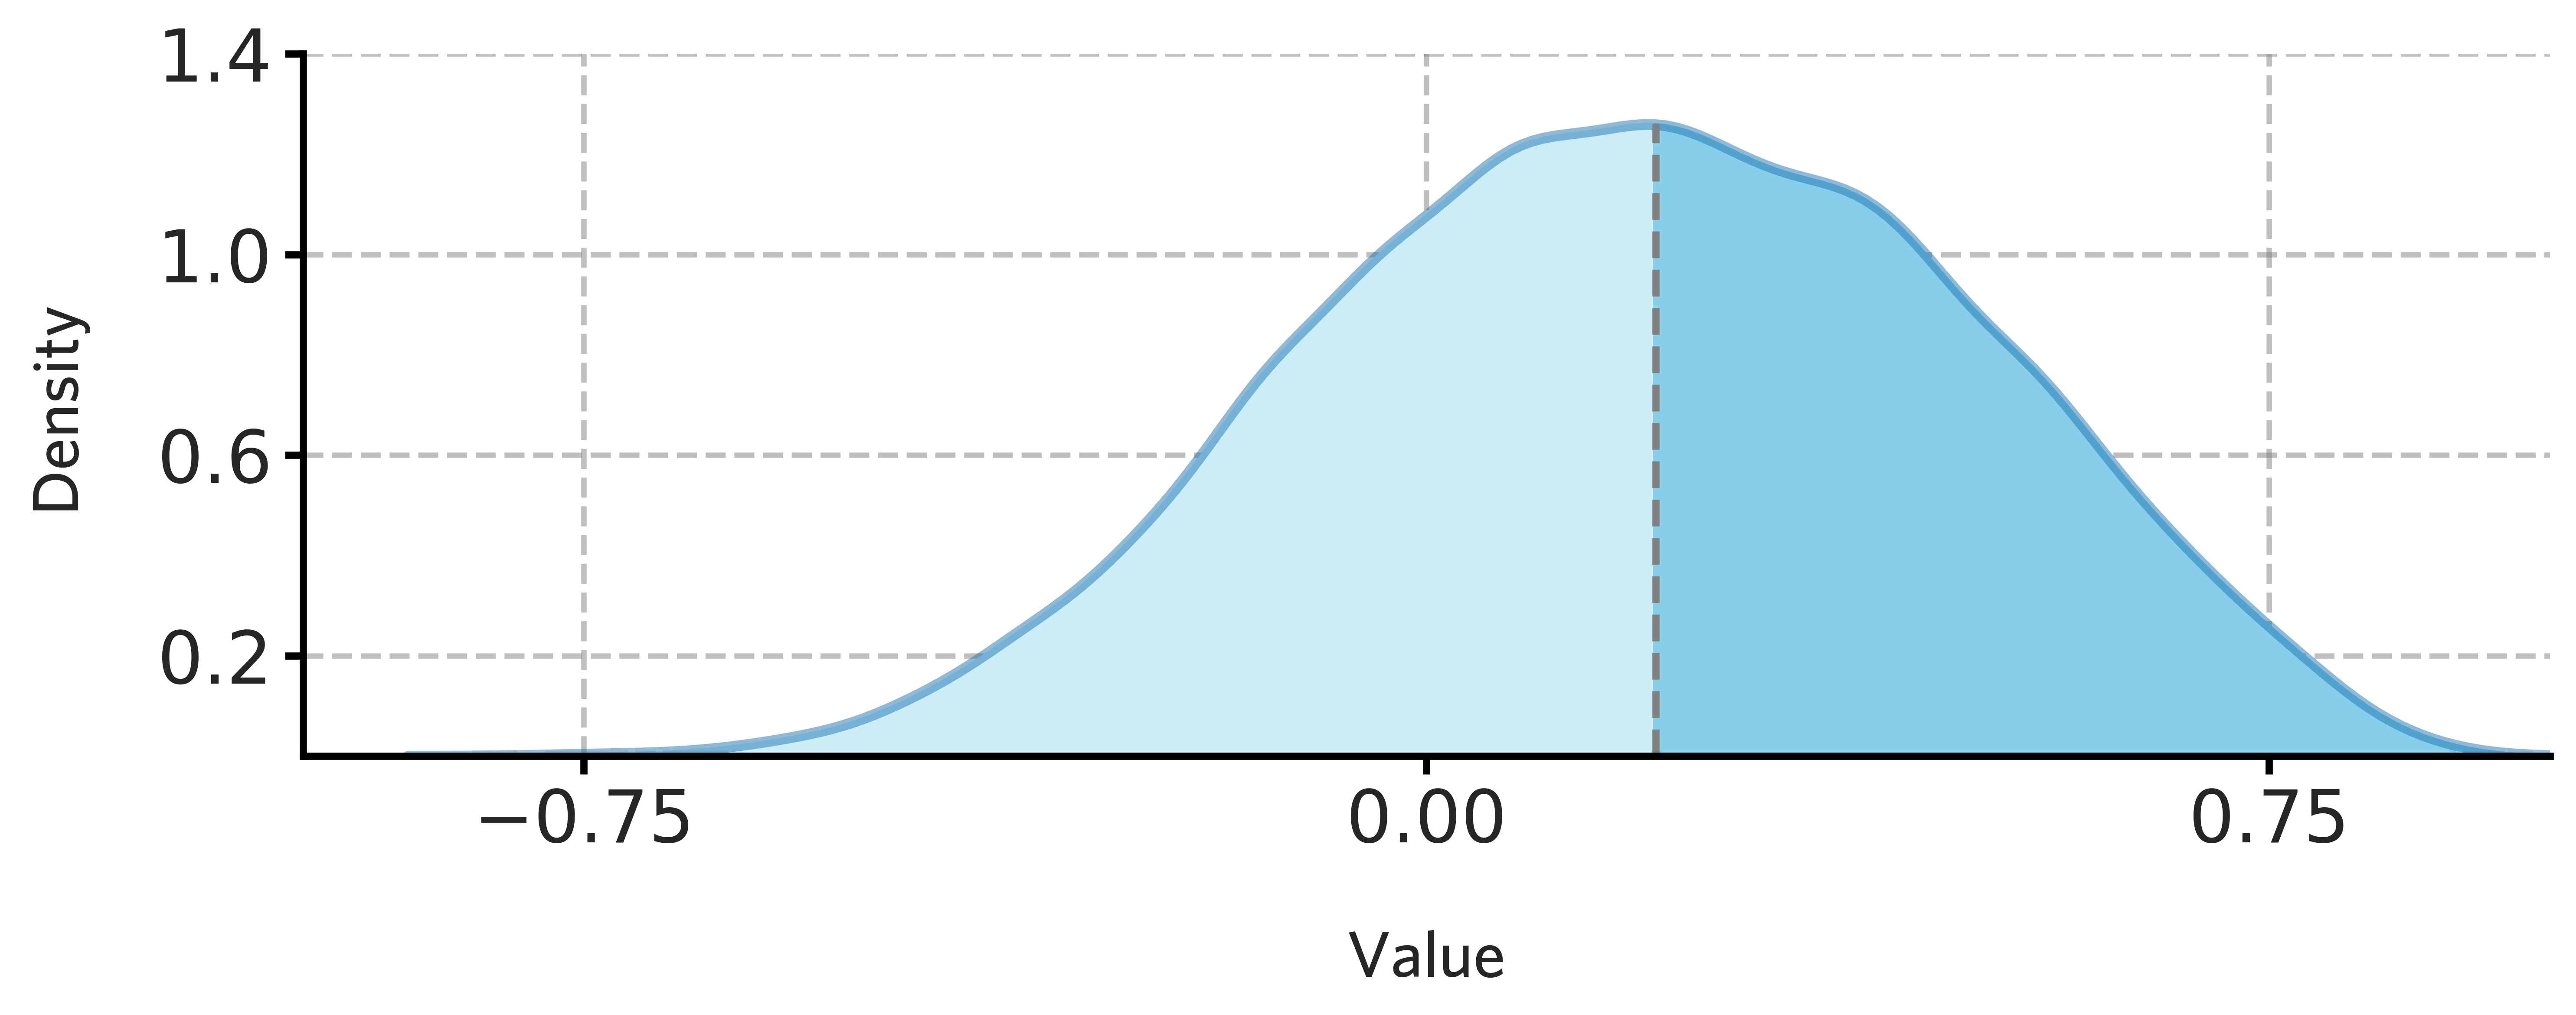
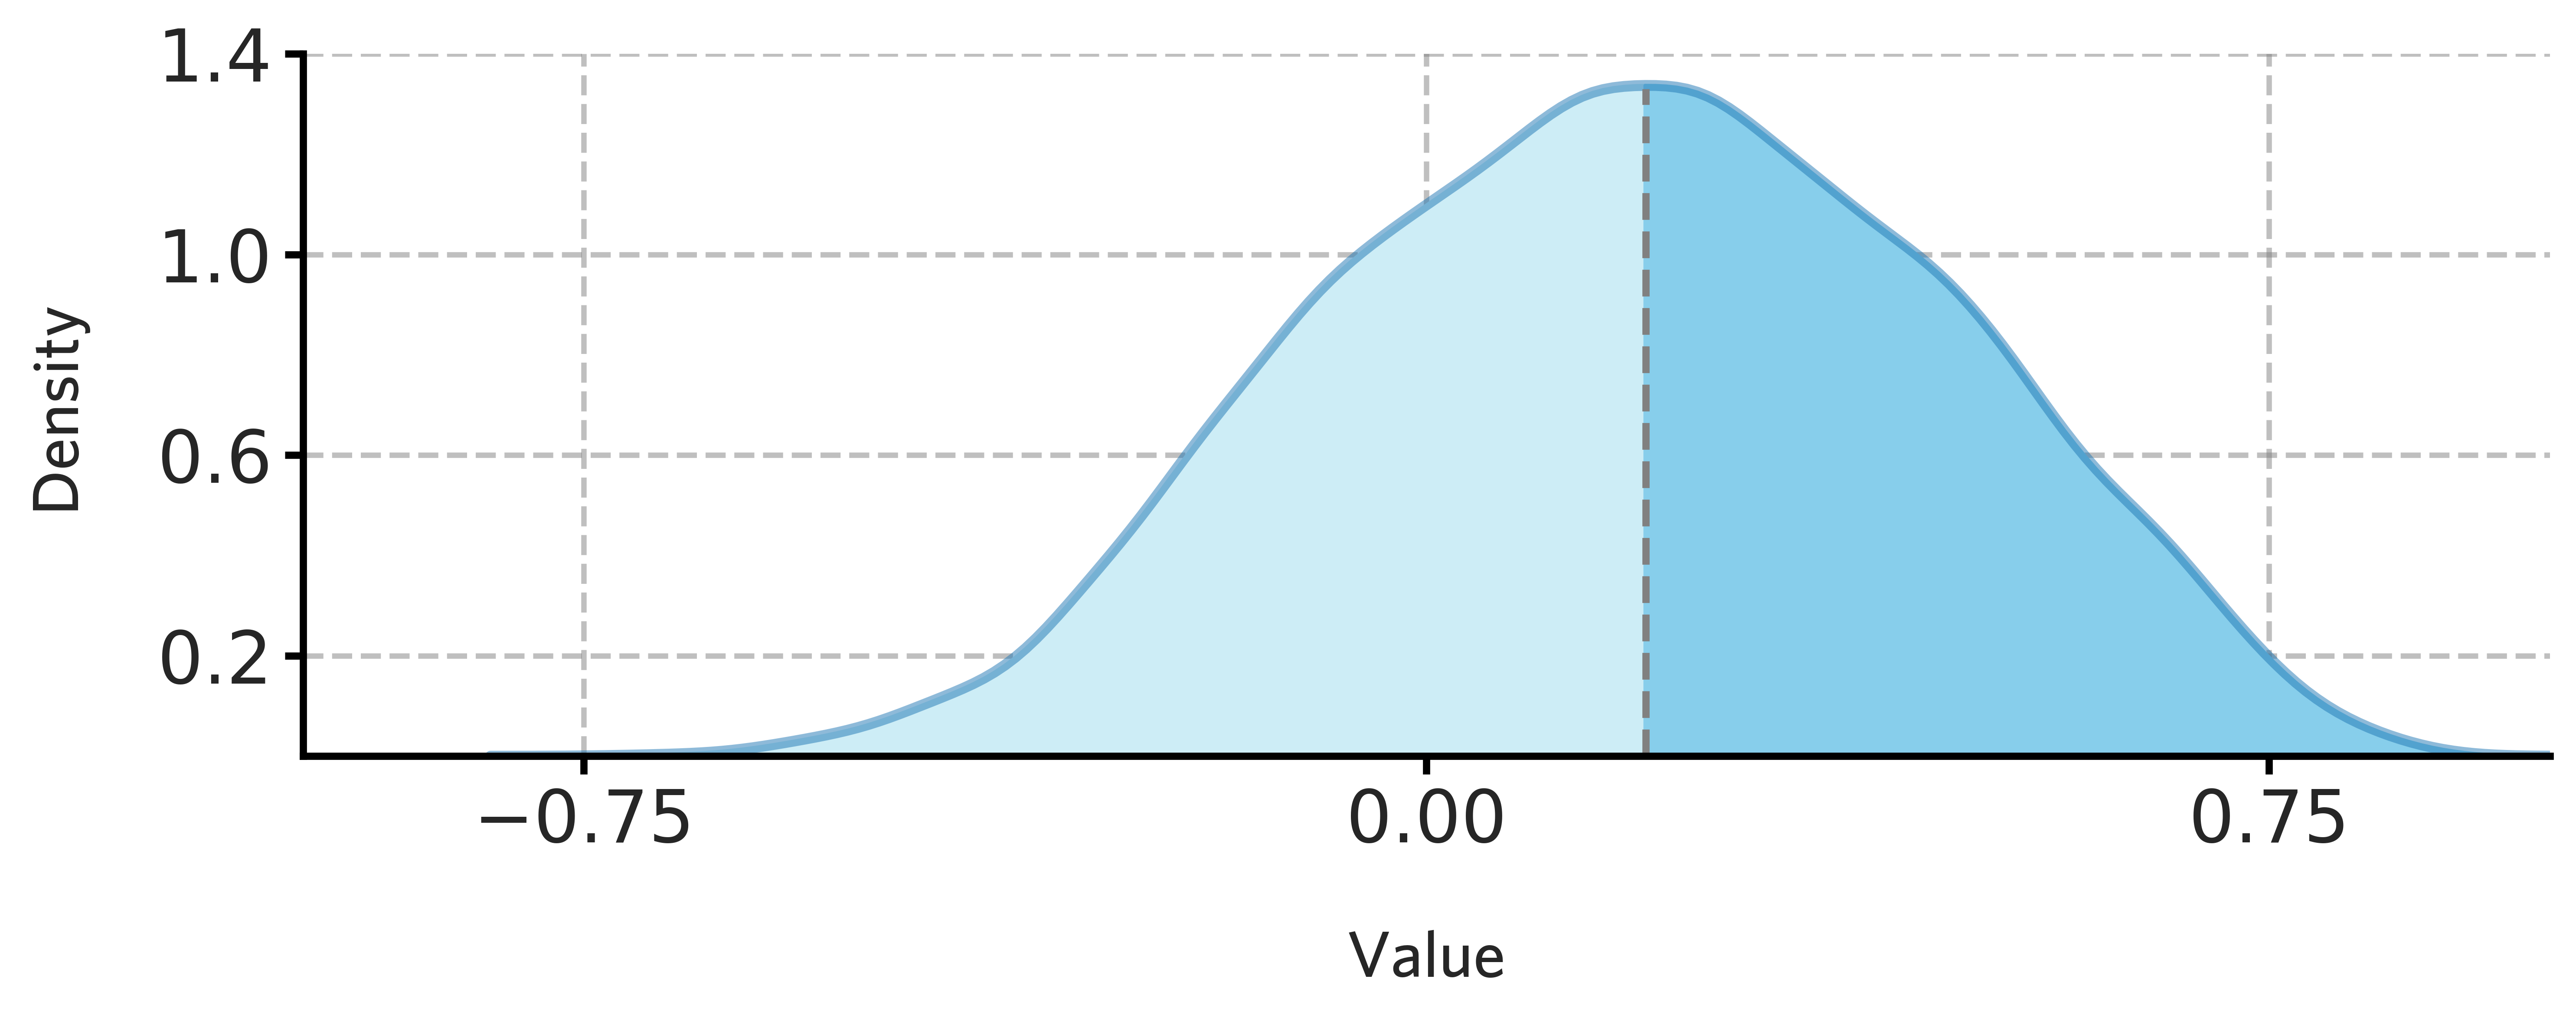
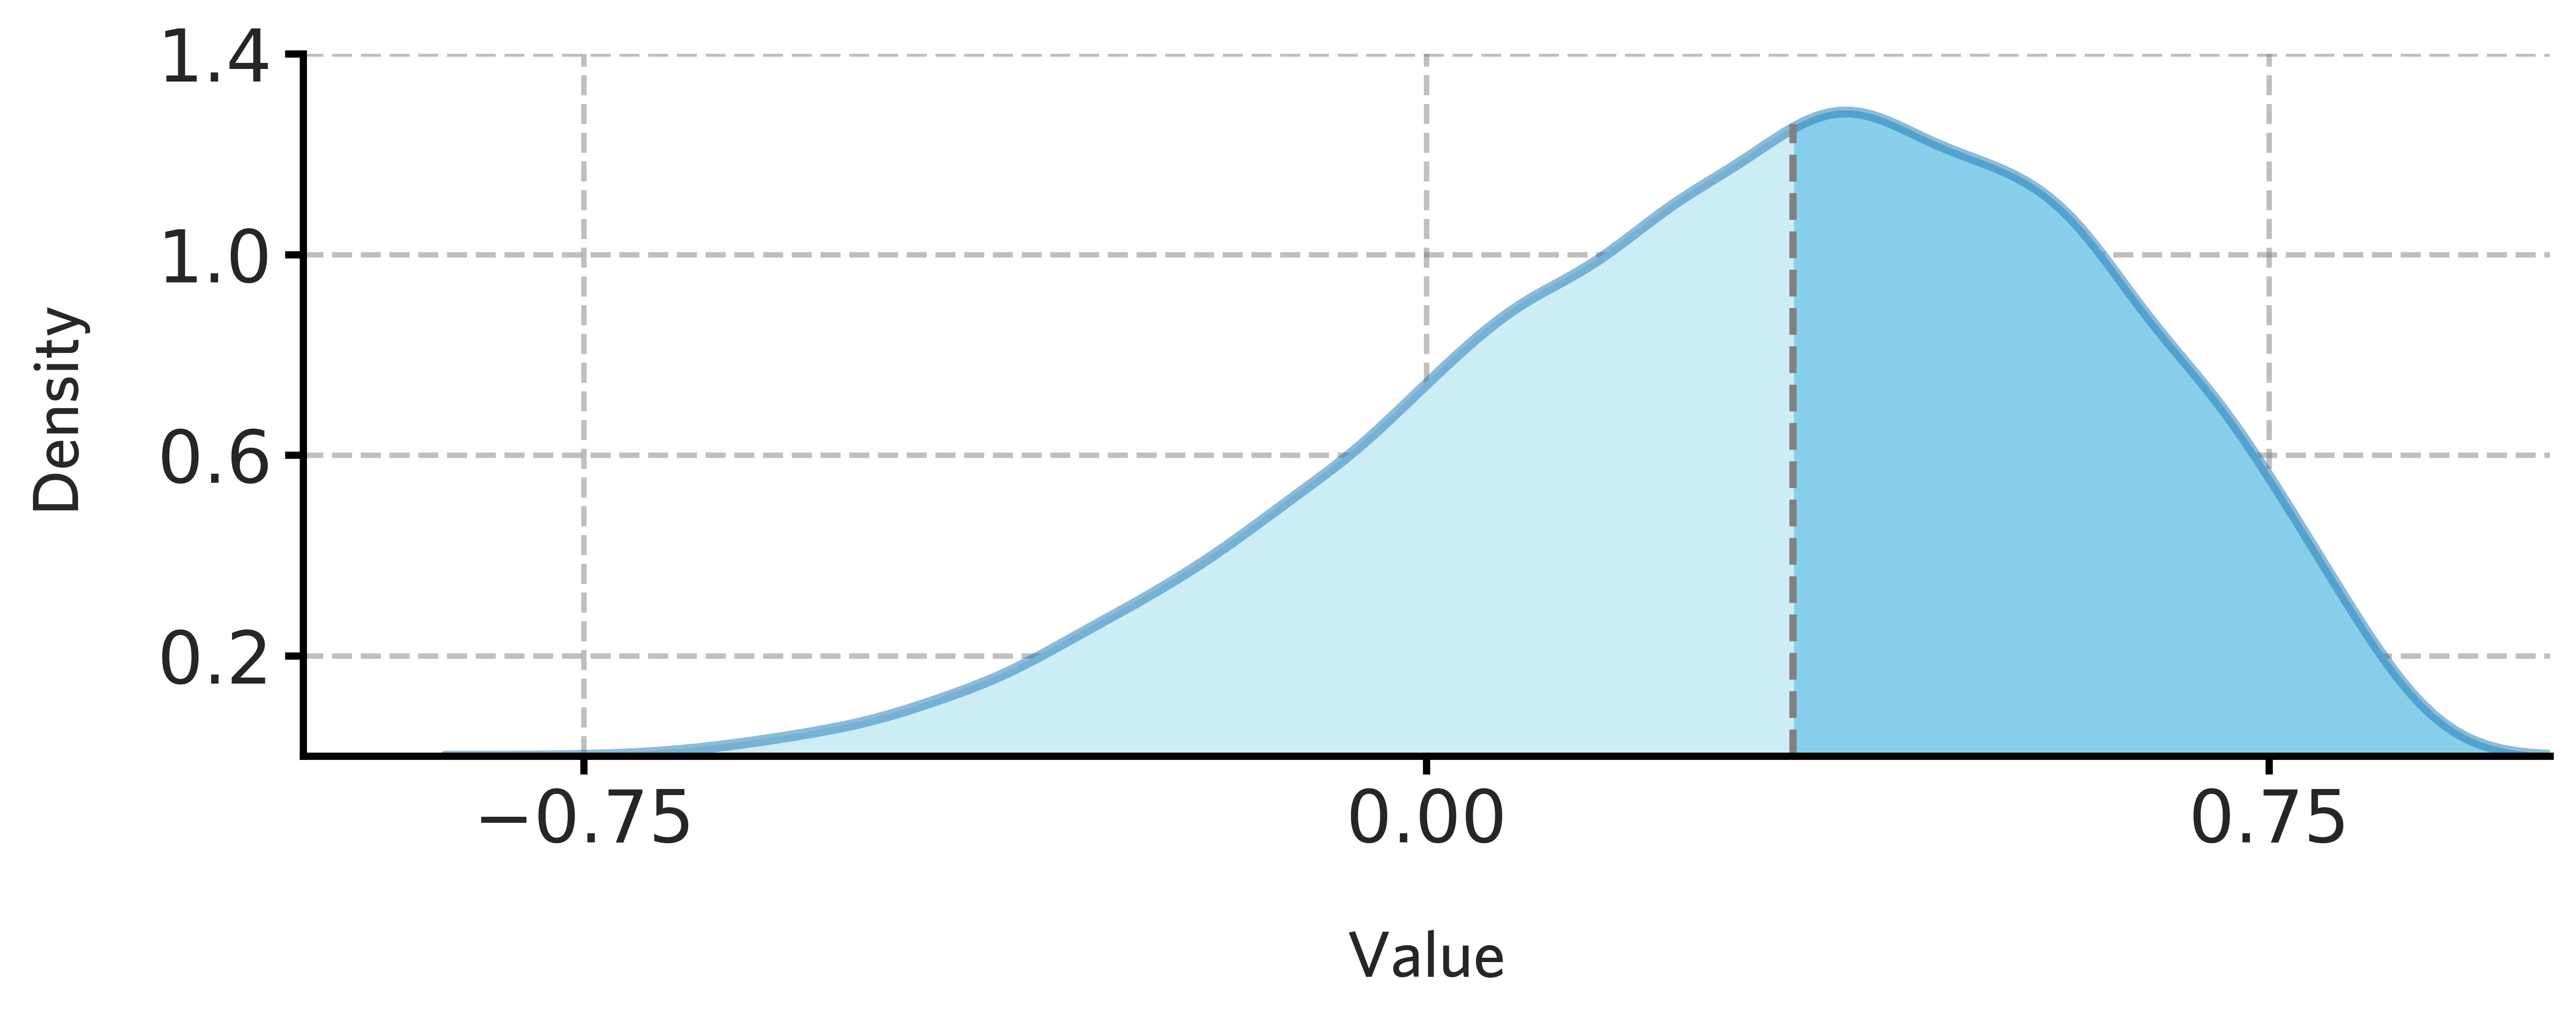
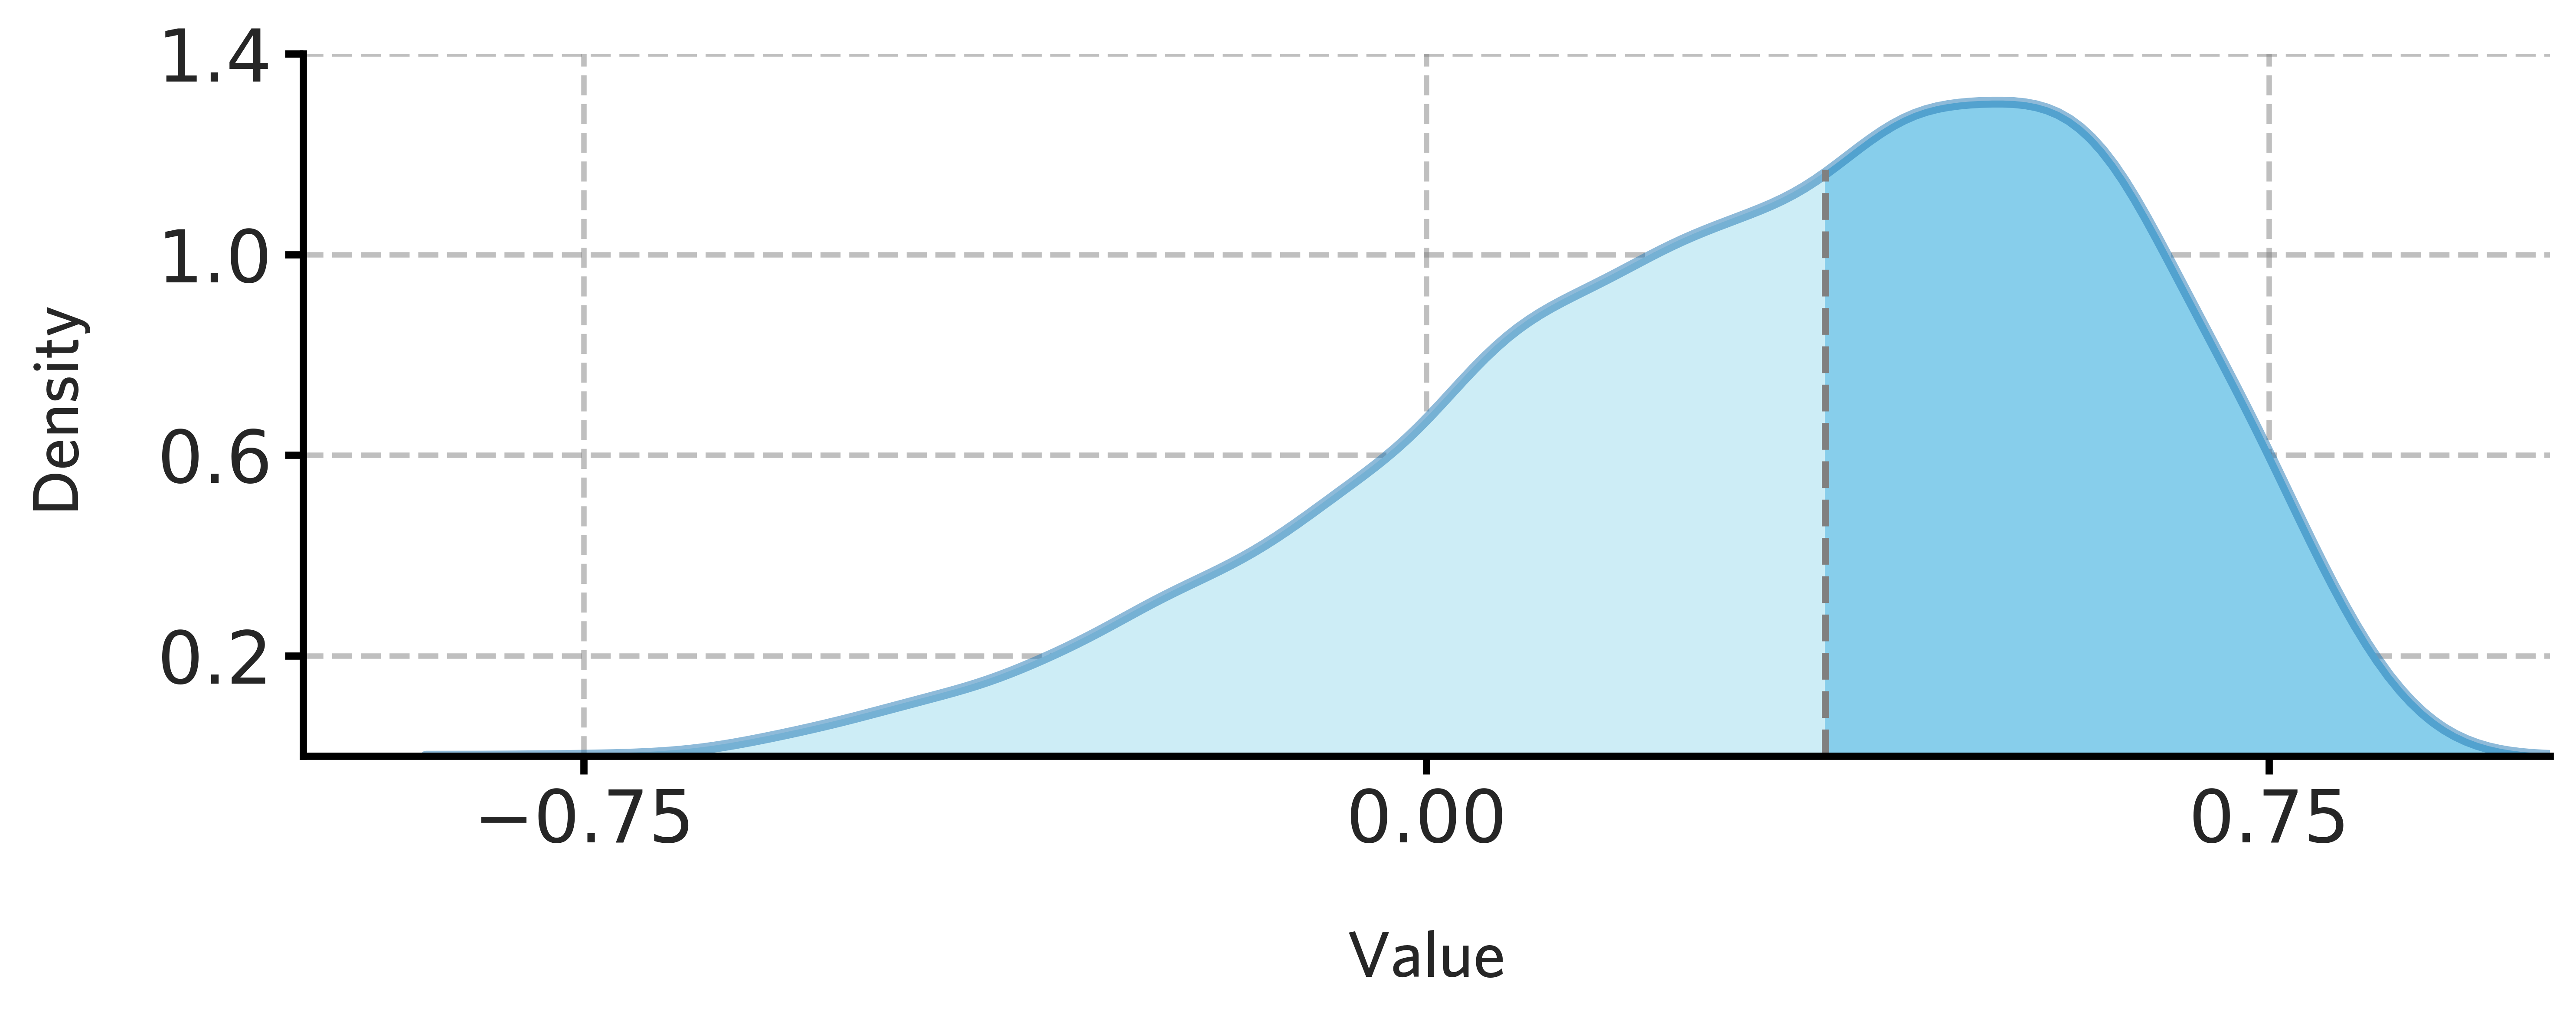
Visualize the spatial similarity distribution
[65]:
fig = draw_distribution(H1901_cortical_stable_gene_scores.values,ymax=0.90)
[66]:
fig.savefig('./fig/H1901_cortical_stable_gene_scores.png',dpi=400)
[67]:
fig = draw_distribution(H1902_cortical_stable_gene_scores.values,offset=0.008,ymax=0.95)
[68]:
fig.savefig('./fig/H1902_cortical_stable_gene_scores.png',dpi=400)
[26]:
H1901_stable_genes_cortex = H1901_cortical_stable_gene_scores[H1901_cortical_stable_gene_scores['correlation'] >= H1901_thre_cortex]
H1902_stable_genes_cortex = H1902_cortical_stable_gene_scores[H1902_cortical_stable_gene_scores['correlation'] >= H1902_thre_cortex]
[27]:
common_stable_genes_cortex = pd.DataFrame([i for i in H1901_stable_genes_cortex.index.values if i in H1902_stable_genes_cortex.index.values],columns=['genes'])
[29]:
common_stable_genes_cortex.to_csv('./files/common_stable_genes_cortex.csv')
Selection of subcortical stable genes
[69]:
ex_sn_subcortex_mean = pd.read_csv('../datasets/processeddata/human_ahba/ex_d_sample_sn_atlas_subcortex_mean.csv',index_col=0)
[70]:
ex_sn_subcortex_mean.index = ['Human '+region.split(' - ')[-1] for region in ex_sn_subcortex_mean.index.values]
[71]:
H1901_data_subcortex = H1901_data[~cortex_filter_H1901]
H1902_data_subcortex = H1902_data[~cortex_filter_H1902]
[72]:
H1901_data_subcortex.index = ['Human '+region.split(' - ')[-1] for region in H1901_data_subcortex.index.values]
H1902_data_subcortex.index = ['Human '+region.split(' - ')[-1] for region in H1902_data_subcortex.index.values]
[73]:
common_regions_subcortex = [i for i in set(H1901_data_subcortex.index.values) if i in ex_sn_subcortex_mean.index.values]
[74]:
H1901_subcortical_stable_gene_scores = stable_gene_filter(ex_sn_subcortex_mean, H1901_data_subcortex, common_regions_subcortex,common_genes)
H1902_subcortical_stable_gene_scores = stable_gene_filter(ex_sn_subcortex_mean, H1902_data_subcortex, common_regions_subcortex,common_genes)
Processing genes...: 100%|██████████| 12732/12732 [00:04<00:00, 2796.89it/s]
Processing genes...: 100%|██████████| 12732/12732 [00:04<00:00, 2858.51it/s]
[75]:
H1901_thre_subcortex = np.median(H1901_subcortical_stable_gene_scores.values)
H1902_thre_subcortex = np.median(H1902_subcortical_stable_gene_scores.values)
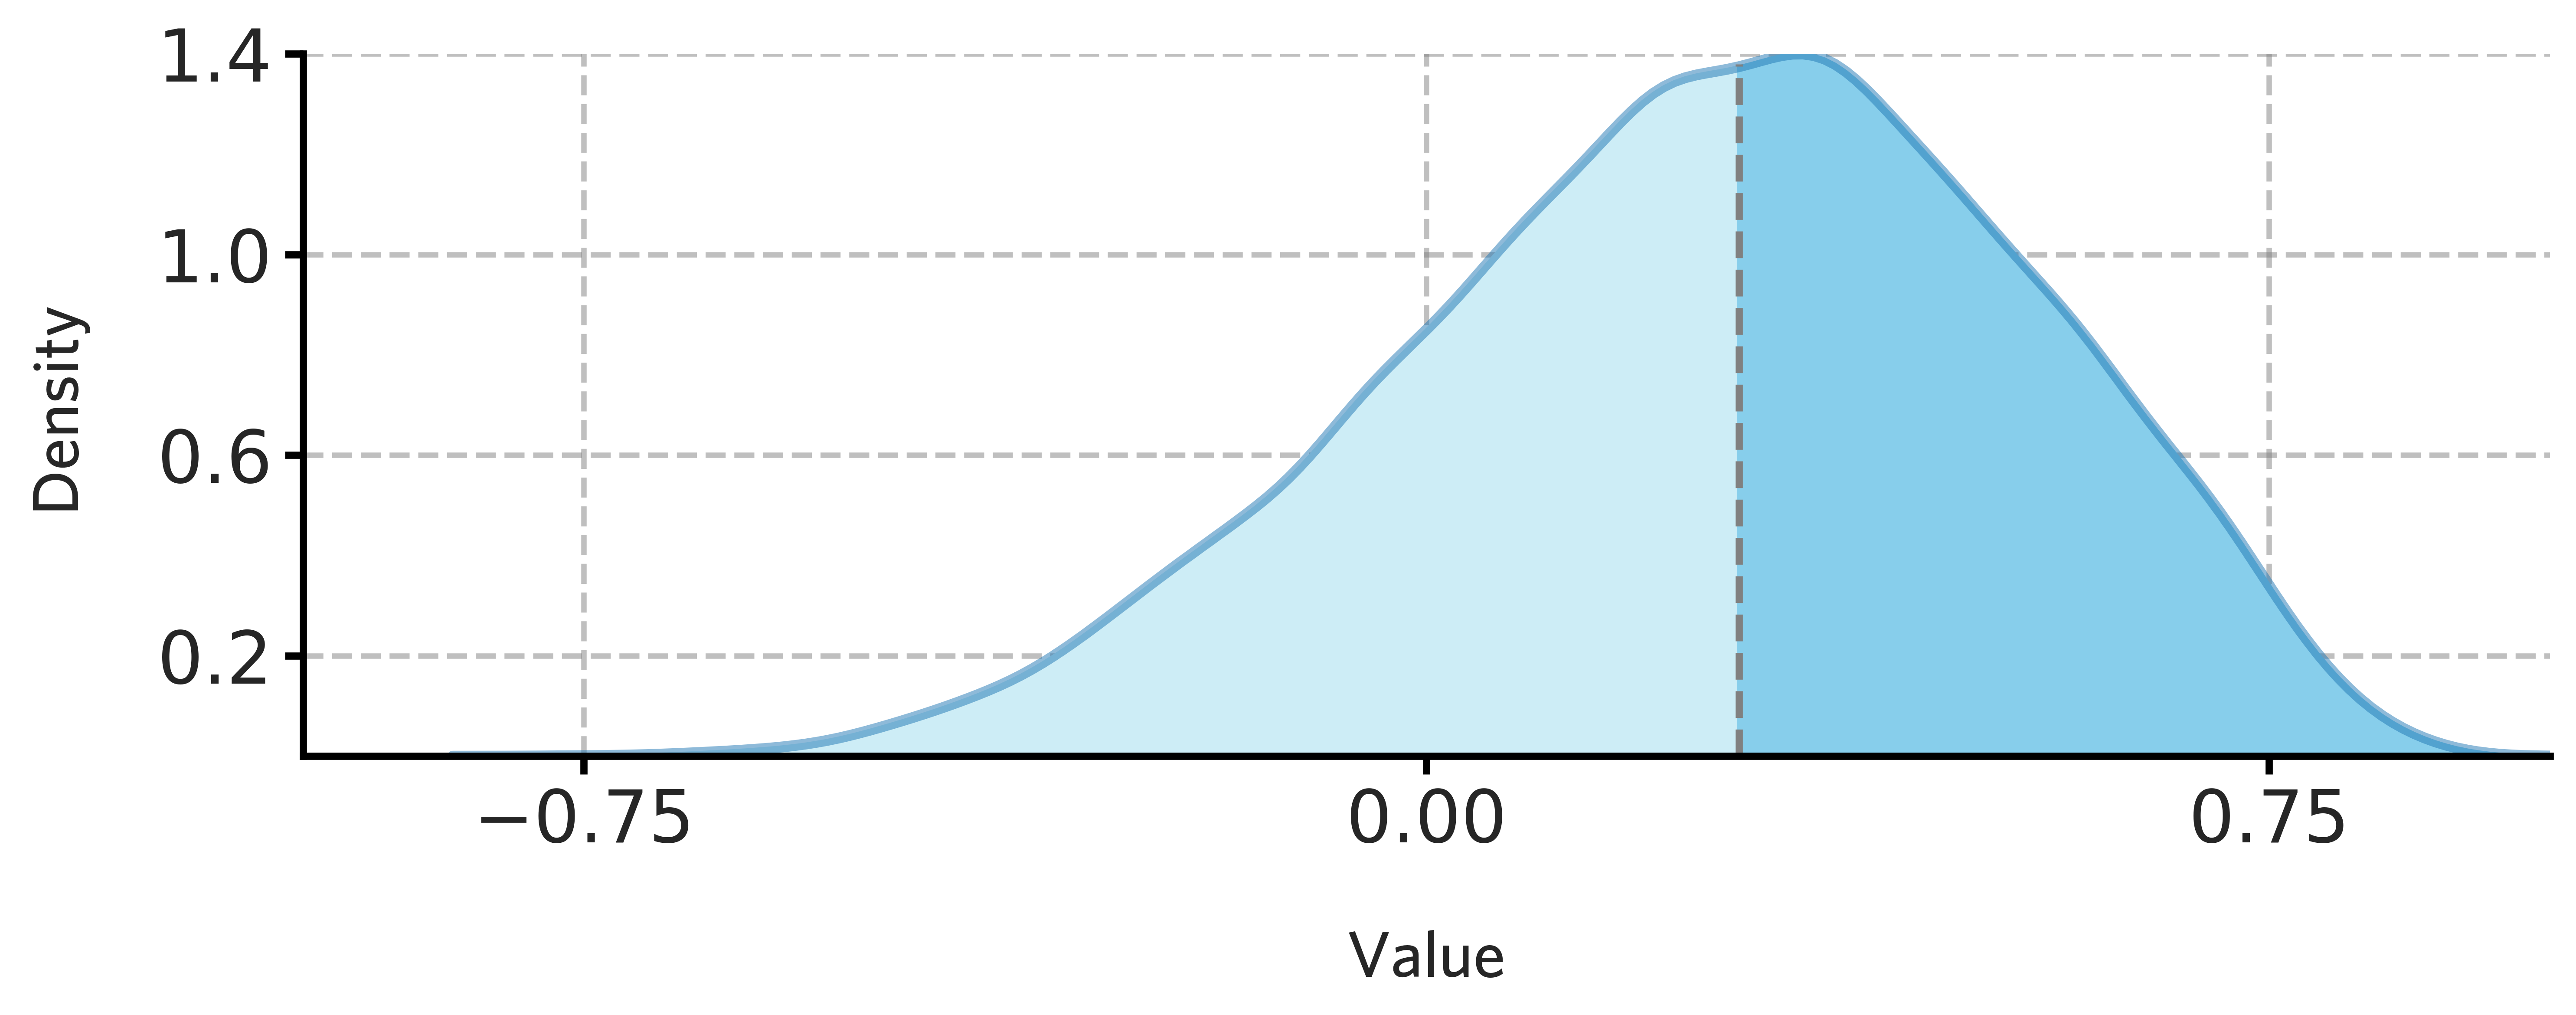
[83]:
fig = draw_distribution(H1901_subcortical_stable_gene_scores.values,offset=0.008,ymax=0.985)
[84]:
fig.savefig('./fig/H1901_subcortical_stable_gene_scores.png',dpi=400)
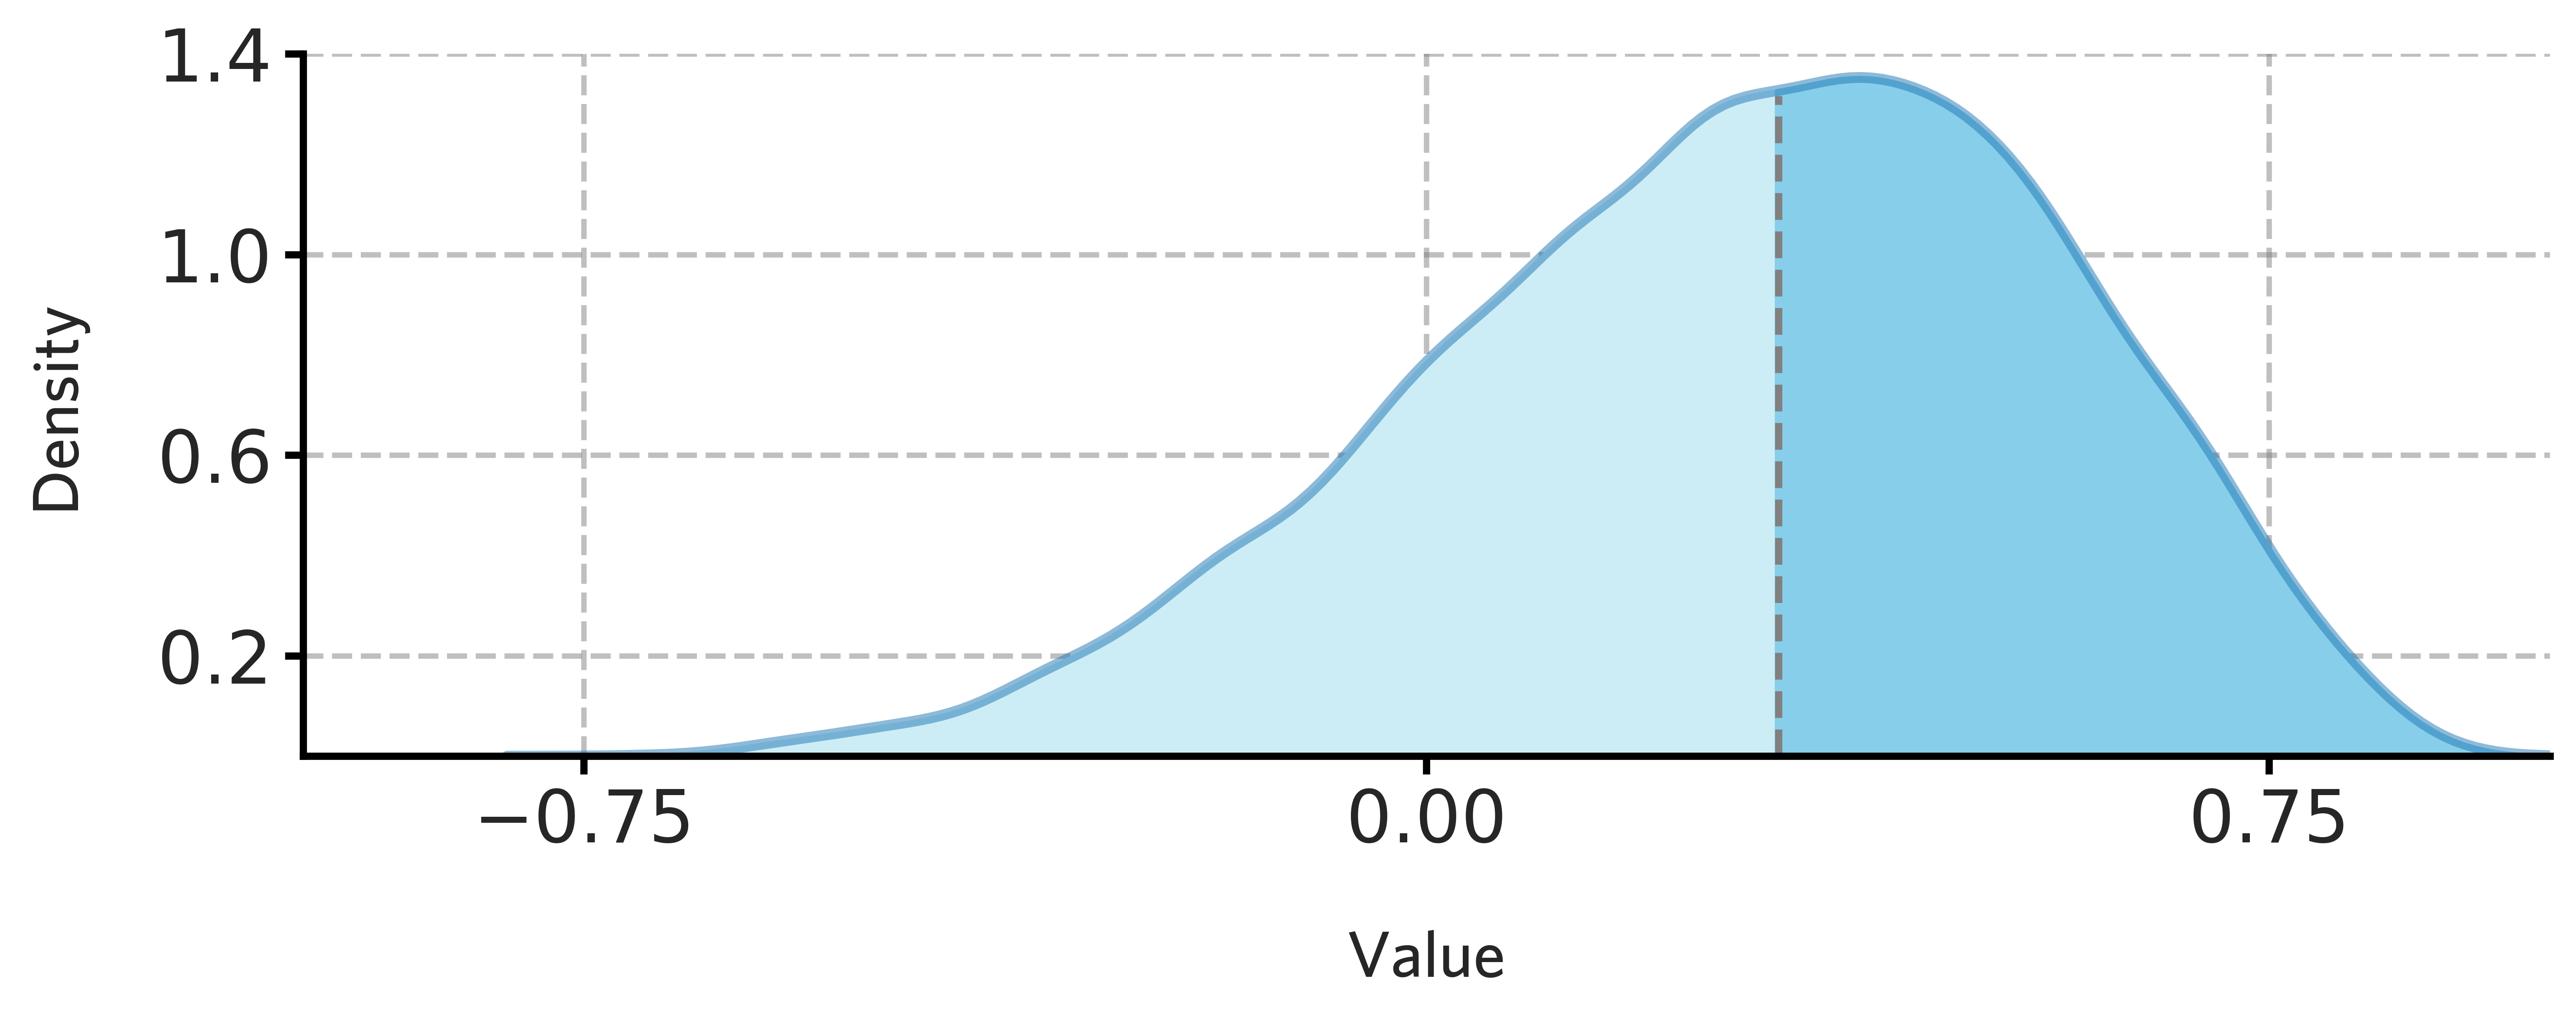
[86]:
fig = draw_distribution(H1902_subcortical_stable_gene_scores.values,offset=0.008,ymax=0.94)
[87]:
fig.savefig('./fig/H1902_subcortical_stable_gene_scores.png',dpi=400)
[39]:
H1901_stable_genes_subcortex = H1901_subcortical_stable_gene_scores[H1901_subcortical_stable_gene_scores['correlation'] >= H1901_thre_subcortex]
H1902_stable_genes_subcortex = H1902_subcortical_stable_gene_scores[H1902_subcortical_stable_gene_scores['correlation'] >= H1902_thre_subcortex]
[40]:
common_stable_genes_subcortex = pd.DataFrame([i for i in H1901_stable_genes_subcortex.index.values if i in H1902_stable_genes_subcortex.index.values],columns=['genes'])
[42]:
common_stable_genes_subcortex.to_csv('./files/common_stable_genes_subcortex.csv')
Selection of all stable genes
[88]:
H1901_data_all = pd.read_feather('../datasets/processeddata/human_sn/Human_sn_data_H19001_all_scaled.feather')
H1901_data_all.set_index('index',inplace=True,drop=True)
H1902_data_all = pd.read_feather('../datasets/processeddata/human_sn/Human_sn_data_H19002_all_scaled.feather')
H1902_data_all.set_index('index',inplace=True,drop=True)
[89]:
ex_sn_mean = pd.read_csv('../datasets/processeddata/human_ahba/ex_d_sample_sn_atlas_mean.csv',index_col=0)
[90]:
ex_sn_mean.index = ['Human '+region.split(' - ')[-1] for region in ex_sn_mean.index.values]
[91]:
H1901_data_all.index = ['Human '+region.split(' - ')[-1] for region in H1901_data_all.index.values]
H1902_data_all.index = ['Human '+region.split(' - ')[-1] for region in H1902_data_all.index.values]
[92]:
common_regions = [i for i in set(H1901_data_all.index.values) if i in ex_sn_mean.index.values]
[93]:
H1901_all_stable_gene_scores = stable_gene_filter(ex_sn_mean, H1901_data_all, common_regions, common_genes)
H1902_all_stable_gene_scores = stable_gene_filter(ex_sn_mean, H1902_data_all, common_regions, common_genes)
Processing genes...: 100%|██████████| 12732/12732 [00:04<00:00, 2795.38it/s]
Processing genes...: 100%|██████████| 12732/12732 [00:05<00:00, 2533.27it/s]
[94]:
H1901_thre_all = np.median(H1901_all_stable_gene_scores.values)
H1902_thre_all = np.median(H1902_all_stable_gene_scores.values)
[96]:
fig = draw_distribution(H1901_all_stable_gene_scores.values,offset=0.004,ymax=0.90)
[97]:
fig.savefig('./fig/H1901_all_stable_gene_scores.png',dpi=400)
[100]:
fig = draw_distribution(H1902_all_stable_gene_scores.values,offset=0.003,ymax=0.835)
[101]:
fig.savefig('./fig/H1902_all_stable_gene_scores.png',dpi=400)
[53]:
H1901_stable_genes_all = H1901_all_stable_gene_scores[H1901_all_stable_gene_scores['correlation'] >= H1901_thre_all]
H1902_stable_genes_all = H1902_all_stable_gene_scores[H1902_all_stable_gene_scores['correlation'] >= H1902_thre_all]
[54]:
common_stable_genes_all = pd.DataFrame([i for i in H1901_stable_genes_all.index.values if i in H1902_stable_genes_all.index.values],columns=['genes'])
[56]:
common_stable_genes_all.to_csv('./files/common_stable_genes_all.csv')
[14]:
align_csv = pd.read_csv('./files/sn_ahba_atlas_align.csv',index_col=0)
Thresholds of cortex
[58]:
ex_brain_cortex_mean = pd.read_csv('../datasets/processeddata/human_ahba/ex_d_sample_brain_atlas_cortex_mean.csv',index_col=0)
[59]:
ex_brain_cortex_mean = ex_brain_cortex_mean[common_stable_genes_cortex['genes'].values]
[28]:
cortex_filter_H1901 = H1901_data.index.str.contains('Cerebral cortex')
cortex_filter_H1902 = H1902_data.index.str.contains('Cerebral cortex')
H1901_data_cortex = H1901_data[cortex_filter_H1901]
H1902_data_cortex = H1902_data[cortex_filter_H1902]
[29]:
H19_data_cortex = pd.concat([H1901_data_cortex,H1902_data_cortex])
[33]:
H19_data_cortex = H19_data_cortex[common_stable_genes_cortex['genes'].values]
[36]:
H19_data_cortex.reset_index(inplace=True)
[37]:
H19_data_cortex.to_feather('../datasets/processeddata/human_sn/Human_sn_data_H19_cortex_scaled_common_gene.feather')
[76]:
threshold_dict_cortex = calculate_thresholds(ex_brain_cortex_mean,H19_data_cortex,align_csv)
Processing regions...: 100%|██████████| 127/127 [35:19<00:00, 16.69s/it]
[78]:
threshold_df_cortex = pd.DataFrame.from_dict(threshold_dict_cortex, orient='index', columns=['correlation', 'p_value'])
[79]:
threshold_df_cortex.to_csv('./files/threshold_df_cortex.csv')
[20]:
def plot_thre_distribution(thre_df,bins = np.arange(-0.2, 0.64, 0.02)):

    data_groups = pd.cut(thre_df['correlation'],bins=bins,include_lowest=True)
    grouped_counts = data_groups.value_counts(normalize=True)

    fig, ax = plt.subplots(1,1,figsize=(15,6), gridspec_kw={'width_ratios': [2]},dpi=400)
    sns.barplot(x=grouped_counts.index, y=grouped_counts.values,label='align similarity',alpha=0.5,color='skyblue')
    plt.xticks(rotation=90)
    ax.tick_params(labelsize=15)
    ax.spines['left'].set_linewidth(1)
    ax.spines['bottom'].set_linewidth(1)
    ax.xaxis.labelpad = 20
    ax.yaxis.labelpad = 20
    plt.xlabel("Value",fontsize=18,fontproperties=custom_font)
    plt.ylabel("Frequency",fontsize=18,fontproperties=custom_font)
    ax.legend(prop=FontProperties(fname=font_path,size=15))
    plt.show()
[81]:
plot_thre_distribution(threshold_df_cortex)

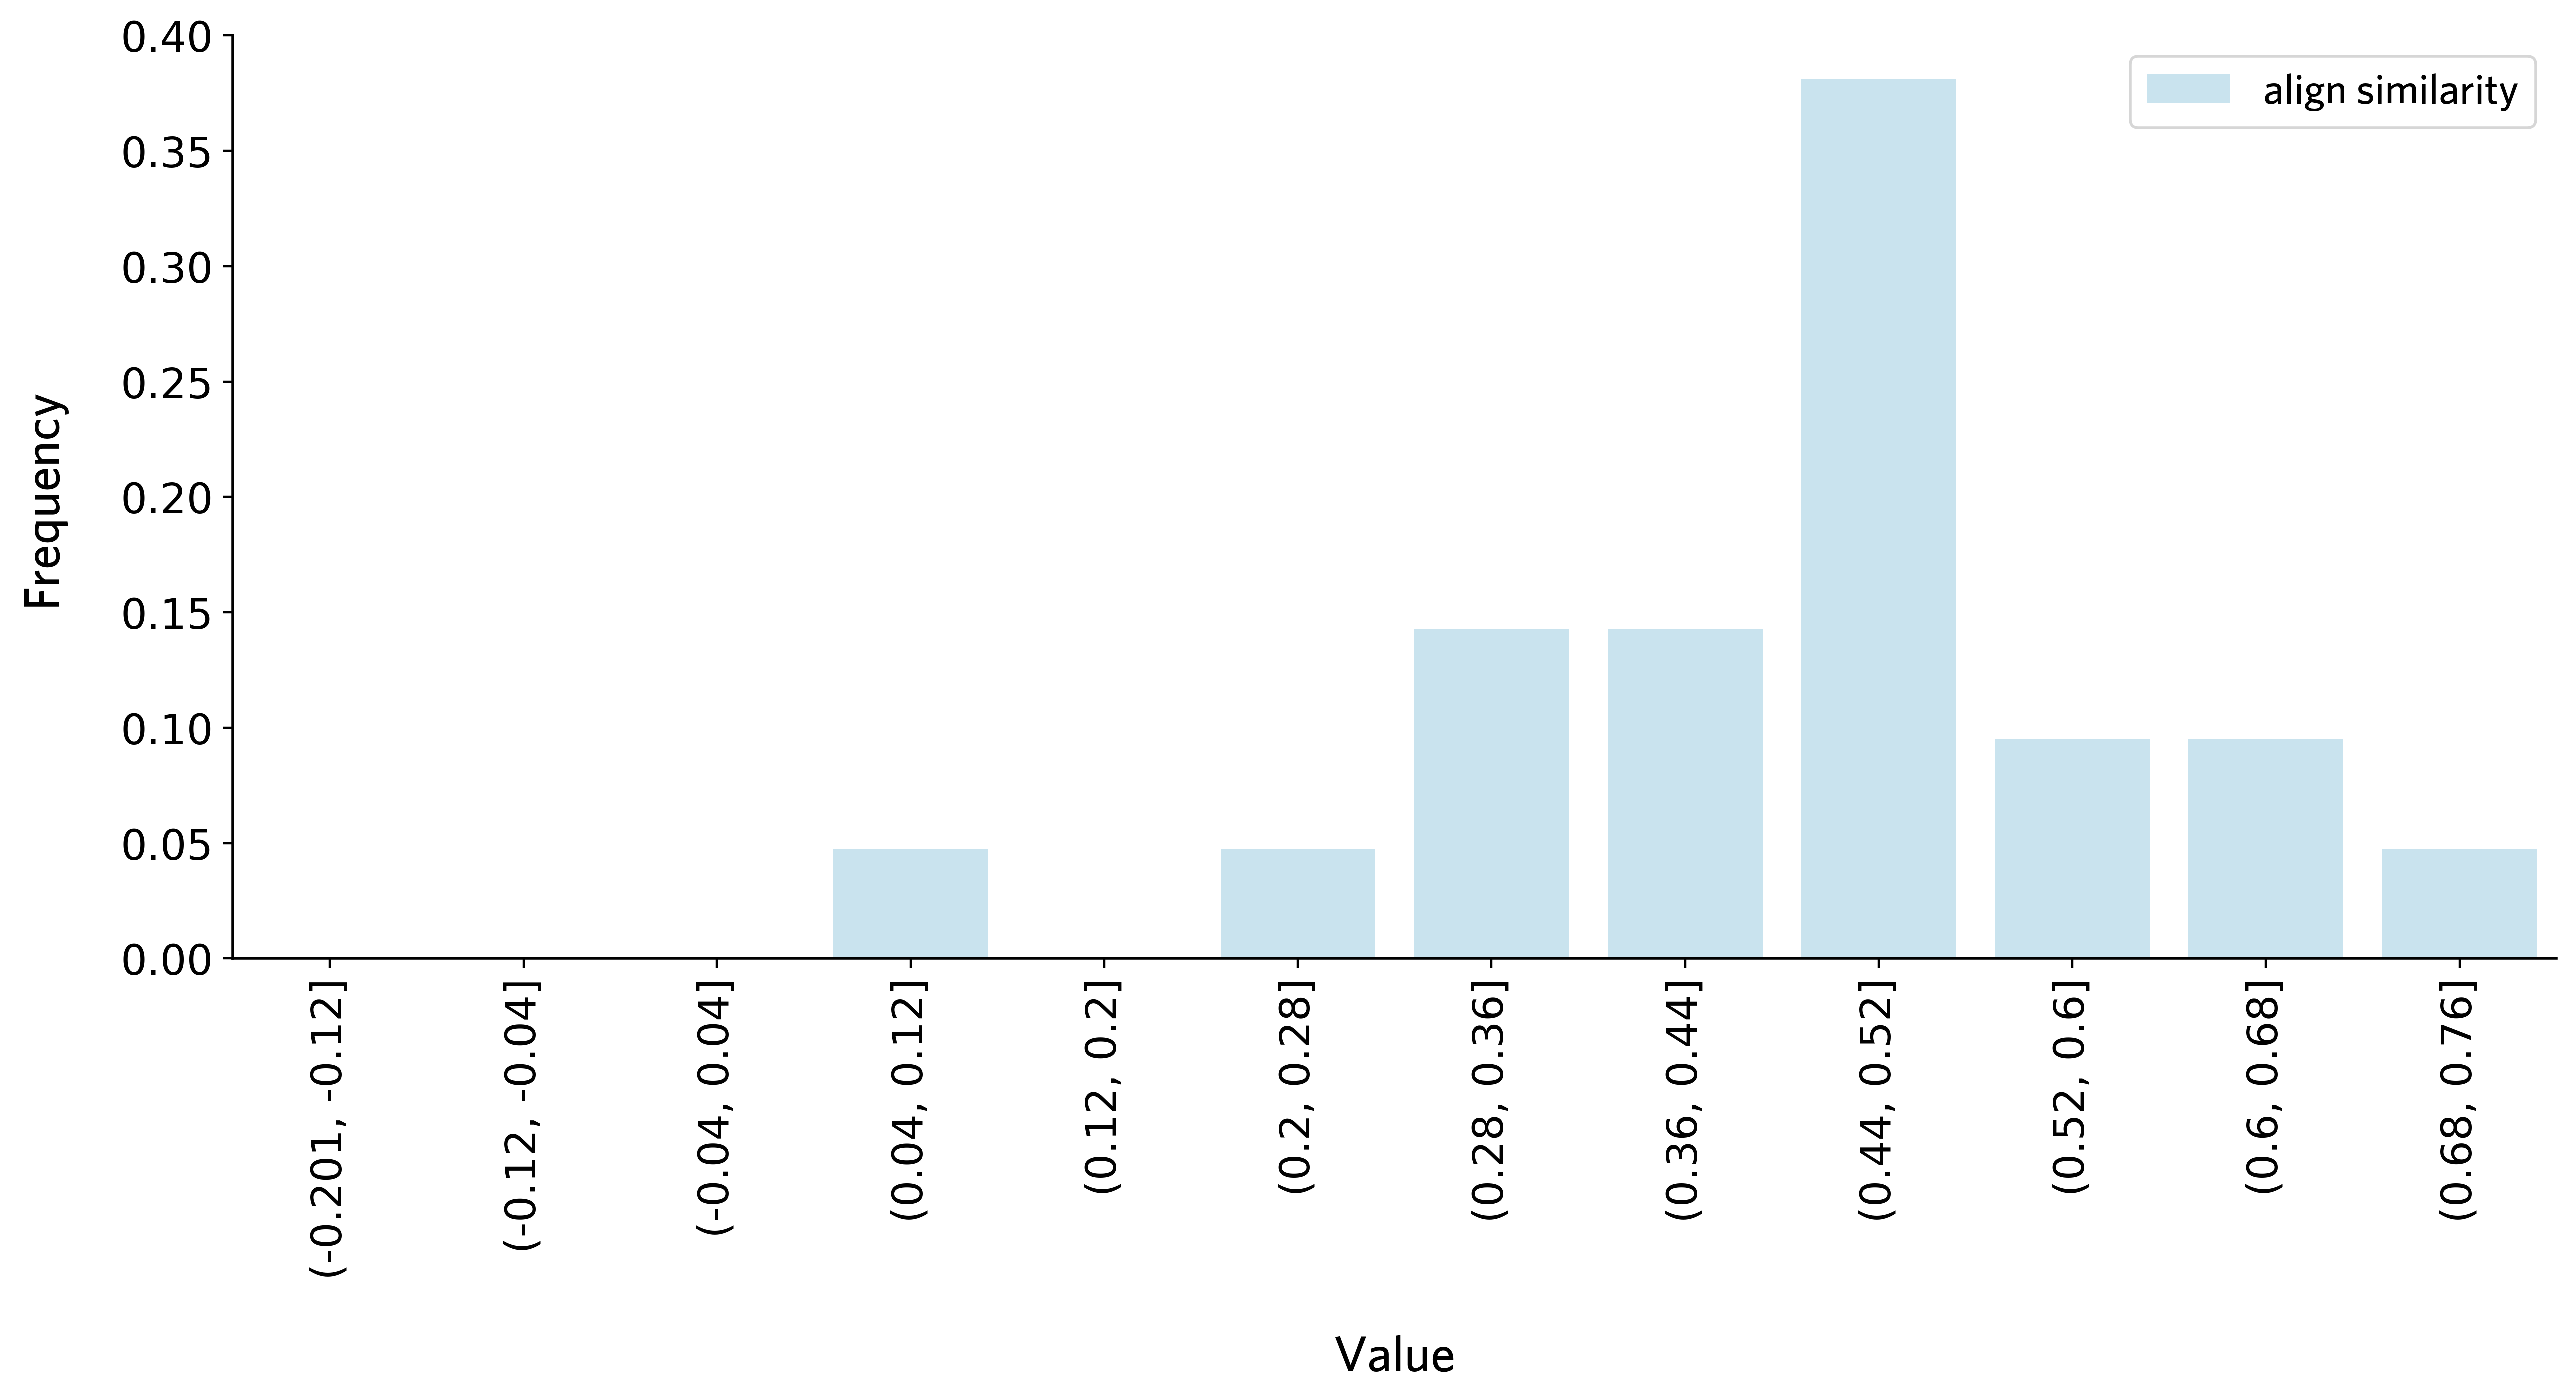
Thresholds of subcortex
[83]:
ex_brain_subcortex_mean = pd.read_csv('../datasets/processeddata/human_ahba/ex_d_sample_brain_atlas_subcortex_mean.csv',index_col=0)
[84]:
ex_brain_subcortex_mean = ex_brain_subcortex_mean[common_stable_genes_subcortex['genes'].values]
[38]:
H1901_data_subcortex = H1901_data[~cortex_filter_H1901]
H1902_data_subcortex = H1902_data[~cortex_filter_H1902]
[39]:
H19_data_subcortex = pd.concat([H1901_data_subcortex,H1902_data_subcortex])
[40]:
H19_data_subcortex = H19_data_subcortex[common_stable_genes_subcortex['genes'].values]
[43]:
H19_data_subcortex.reset_index(inplace=True)
[44]:
H19_data_subcortex.to_feather('../datasets/processeddata/human_sn/Human_sn_data_H19_subcortex_scaled_common_gene.feather')
[88]:
threshold_dict_subcortex = calculate_thresholds(ex_brain_subcortex_mean,H19_data_subcortex,align_csv)
Processing regions...: 100%|██████████| 127/127 [15:25<00:00, 7.29s/it]
[90]:
threshold_df_subcortex = pd.DataFrame.from_dict(threshold_dict_subcortex, orient='index', columns=['correlation', 'p_value'])
[91]:
threshold_df_subcortex.to_csv('./files/threshold_df_subcortex.csv')
[92]:
plot_thre_distribution(threshold_df_subcortex,bins = np.arange(-0.2, 0.84, 0.08))
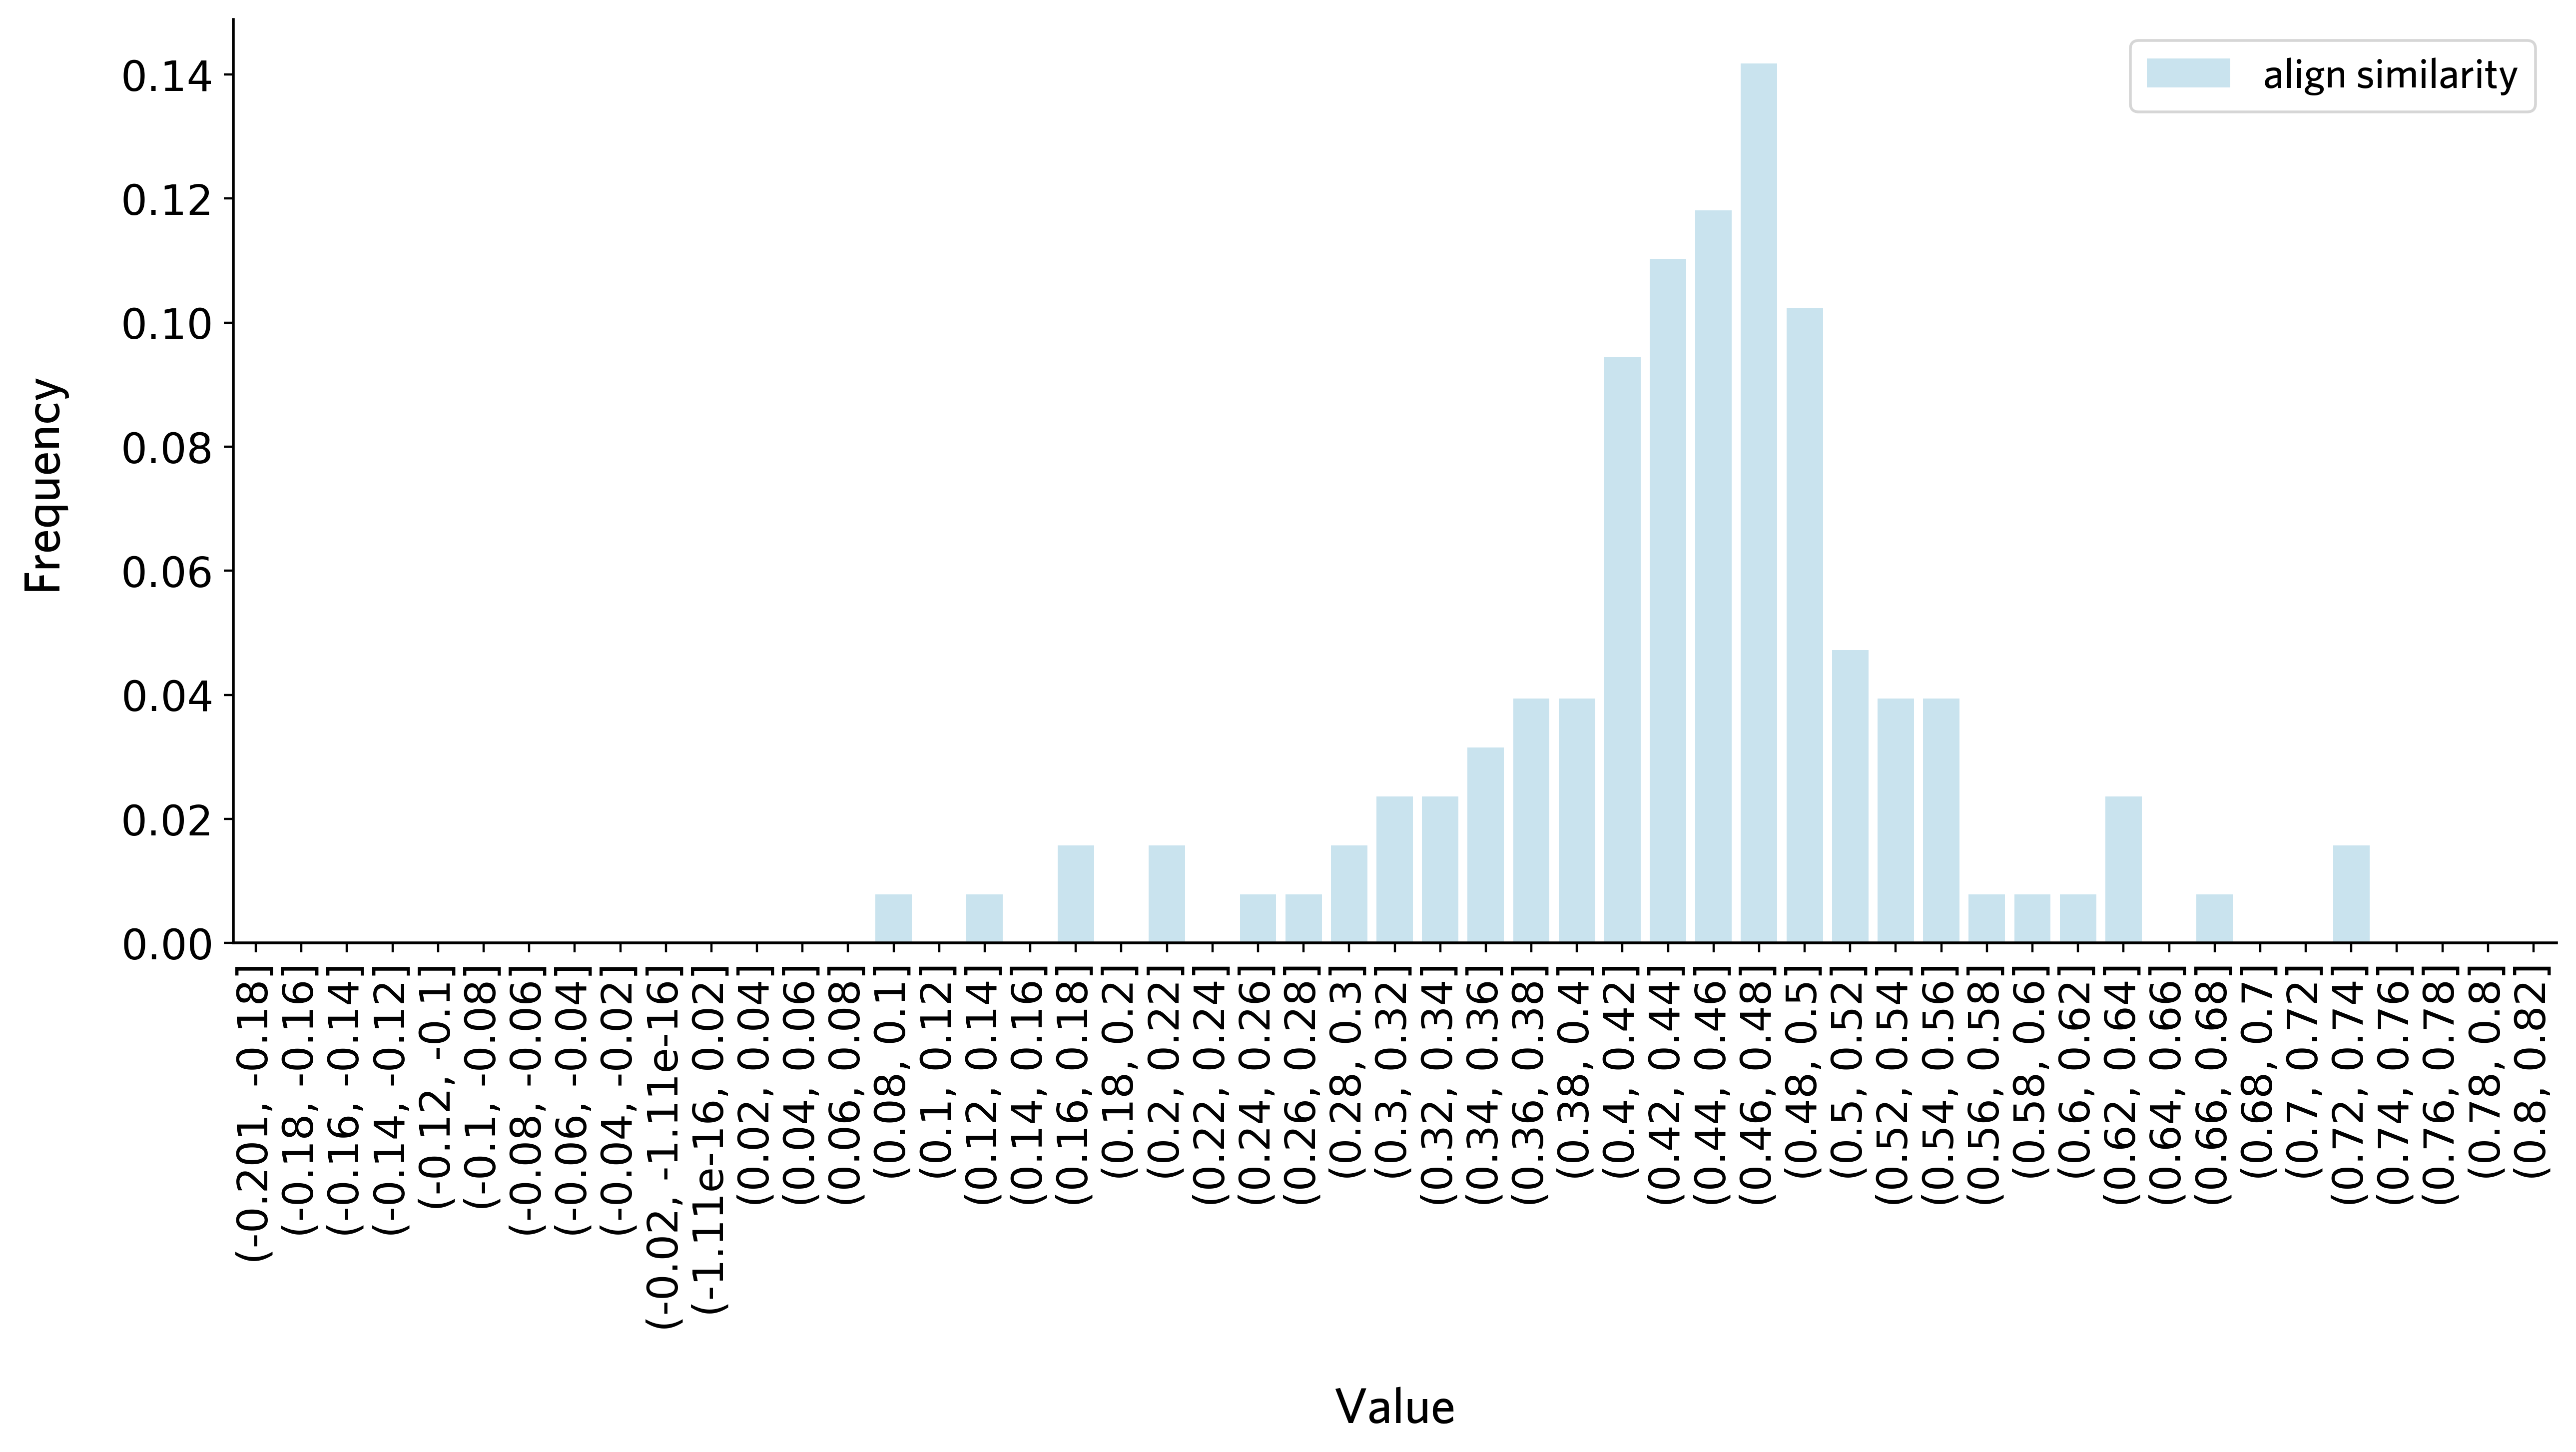
Thresholds of all
[6]:
ex_brain_mean = pd.read_csv('../datasets/processeddata/human_ahba/ex_d_sample_brain_atlas_mean.csv',index_col=0)
[8]:
common_stable_genes_all = pd.read_csv('./files/common_stable_genes_all.csv',index_col=0)
[9]:
ex_brain_mean = ex_brain_mean[common_stable_genes_all['genes'].values]
[10]:
H1901_data_all = pd.read_feather('../datasets/processeddata/human_sn/Human_sn_data_H19001_all_scaled.feather')
H1901_data_all.set_index('index',inplace=True,drop=True)
H1902_data_all = pd.read_feather('../datasets/processeddata/human_sn/Human_sn_data_H19002_all_scaled.feather')
H1902_data_all.set_index('index',inplace=True,drop=True)
[11]:
H19_data_all = pd.concat([H1901_data_all,H1902_data_all])
[12]:
H19_data_all = H19_data_all[common_stable_genes_all['genes'].values]
[15]:
threshold_dict_all = calculate_thresholds(ex_brain_mean,H19_data_all,align_csv)
Processing regions...: 100%|██████████| 127/127 [1:04:50<00:00, 30.64s/it]
[17]:
threshold_df_all = pd.DataFrame.from_dict(threshold_dict_all, orient='index', columns=['correlation', 'p_value'])
[18]:
threshold_df_all.to_csv('./files/threshold_df_all.csv')
[21]:
plot_thre_distribution(threshold_df_all,bins = np.arange(-0.2, 0.84, 0.02))
[23]:
H19_data_all.reset_index(inplace=True)
[25]:
H19_data_all.to_feather('../datasets/processeddata/human_sn/Human_sn_data_H19_all_scaled_common_gene.feather')
[11]:
# To run the integration pipeline, use the following command:
# !python ../code/dintegrate/main.py --pool True --pool_type cortex --mean_path ../datasets/processeddata/human_ahba/ex_d_sample_brain_atlas_cortex_mean.csv --sample_path ../datasets/processeddata/human_ahba/ex_d_sample_brain_atlas_cortex.csv --h19_path ../datasets/processeddata/human_sn/Human_sn_data_H19_cortex_scaled_common_gene.feather --alignment_file ./files/sn_ahba_atlas_align_cortex.csv --gene_file ./files/common_stable_genes_cortex.csv --thre_file ./files/threshold_df_cortex.csv --pool_s_path ../datasets/integrated_dataset/cortical_pool  --integrated_s_path ../datasets/integrated_dataset/cortical_integrated
[12]:
# !python ../code/dintegrate/main.py --pool True --pool_type subcortex --mean_path ../datasets/processeddata/human_ahba/ex_d_sample_brain_atlas_subcortex_mean.csv --sample_path ../datasets/processeddata/human_ahba/ex_d_sample_brain_atlas_subcortex.csv --h19_path ../datasets/processeddata/human_sn/Human_sn_data_H19_subcortex_scaled_common_gene.feather --alignment_file ./files/sn_ahba_atlas_align_subcortex.csv --gene_file ./files/common_stable_genes_subcortex.csv --thre_file ./files/threshold_df_subcortex.csv --pool_s_path ../datasets/integrated_dataset/subcortical_pool --integrated_s_path ../datasets/integrated_dataset/subcortical_integrated
[13]:
# !python ../code/dintegrate/main.py --pool True --pool_type all --mean_path ../datasets/processeddata/human_ahba/ex_d_sample_brain_atlas_mean.csv --sample_path ../datasets/processeddata/human_ahba/ex_d_sample_brain_atlas.csv --h19_path ../datasets/processeddata/human_sn/Human_sn_data_H19_all_scaled_common_gene.feather --alignment_file ./files/sn_ahba_atlas_align.csv --gene_file ./files/common_stable_genes_all.csv --thre_file ./files/threshold_df_all.csv --pool_s_path ../datasets/integrated_dataset/all_pool --integrated_s_path ../datasets/integrated_dataset/all_integrated